Cluster analysis as defined by a statistician: A procedure by which subjects, cases, or variables are clustered into groups based on similar characteristics of each. Hierarchical cluster analysis attempts to identify relatively homogenous groups of variables (or cases) based on selected characteristics. An algorithm is used that starts each variable (or case) in a separate cluster and combines clusters until only one is left.
Seem complicated? Described like that, it sure sounds it…but in concept, it’s not. Keep reading and you’ll realize you already understand it.
Cluster analysis as defined by me, the non-statistician, with help from a statistician: Although performing a cluster analysis is complex, the concept really isn’t. For example, teenagers are world-renown for gathering into cliques. An astute observer can tell something about the individual by the group he or she spends the most time with. Teenagers will group together over some variable or variables, be it economic status, looks, intelligence, ethnicity, strength, fitness, or national origin. By studying the groups that form, you can discover the variables that are important to teens, once you have a large enough sample.
You might also notice that there are some teens that are able to travel between multiple groups, even though there is one group they are most drawn to. The “attractive” teen may occasionally talk to the “smart but ugly” teen when help with a test is needed. The athletes may get to hang out with the “attractive” group if the team is doing well. But in the end, each person will likely spend a majority of his or her time with a particular group. If you understand this, then you understand cluster analysis. The output really is that simple.
For another example, take a look at the modern adult male. As men travel around during the day, there are certain things that tend to travel with them: keys, identification, a phone, a pen, a wallet, cash, and coins. Some of those items will tend to be carried in certain places (such as a back pocket for the wallet, or the front right pocket for keys) and sometimes the introduction of one item will change how another is carried. If it is cool enough to allow a jacket, the location of the wallet may change from a back pocket to an inside pocket on the jacket, and keys might move from the pants to the jacket as well. The pen, however, would likely stay in the shirt pocket, provided there was one. In certain contexts, such as those times when a bag or briefcase is carried, the way all the other items are carried could change.
Imagine that each of the variables you are tracking is an individual teenager or item carried by the men. Who ‘hangs out’ with whom? What items tend to be carried together in those various pockets or other locations? Are there certain attributes that appear to bring them together, such as the briefcase? Could weather change things up? How about when flying?
While the math behind cluster analysis is complex, the output of quite understandable by a non-statistician. This is one of the immense benefits that come with combining the efforts of a professional data analyst with the knowledgeable researcher. As an Egyptologist, I don’t have to understand how a cluster analysis is performed in order to make use of its results.
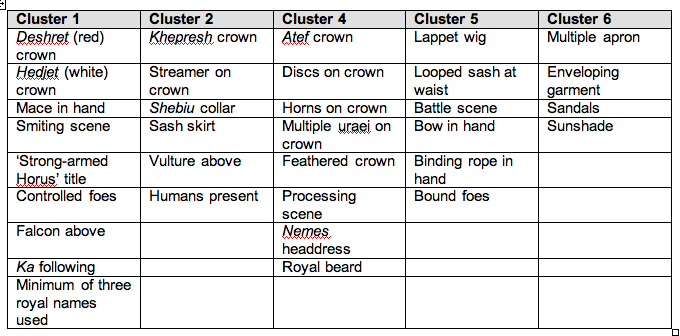
Here are some examples of variables that “tend to hang out together” in the wall scenes at Medinet Habu as calculated by a cluster analysis:
In a future post, I’ll briefly discuss the Egyptological implications of these clusters, but this post is meant primarily as an introduction to the concept. Granted that the math involved in cluster analysis can be somewhat overwhelming, understanding the output is really quite simple and can be of great benefit for quickly seeing how different variables tend to group with one another.
We have statisticians available, such as those in your own university, that have already dedicated their lives to statistics and can (and in many cases be delighted to) analyze your data for you. Another option, though it requires more effort, would be to use advanced statistical software such as SPSS, SAS, and Mplus. Use of these software tools does require some study, but even with my (decidedly limited) math skills, I was able to run many different kind of statistical analyses using SPSS (the most user-friendly to the non-statistician of the three) after some basic reading and tutorials.
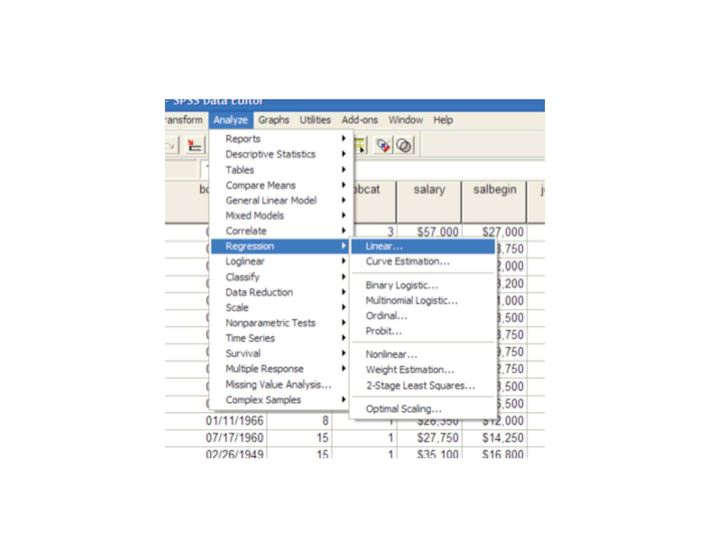
Here is a specific example of how easy it can be to use statistical software. Once you have your data properly formatted in a spreadsheet, you can open it up and analyze it with SPSS. In my case, I wanted to perform a Linear Regression analysis on my Medinet Habu data. All I had to do was select Regression and input the data properly:
See? Not scary.


