A number of people have responded to the red looped sash discussion with a very important question: how, and why, did I choose the looped sash to investigate? The answer is quite simple: the data led me there.
This is the fundamental principle of the Art of Counting project–to utilize a method for recording and investigating scenes that allows the data inherently existing within the visual record to become apparent. When the data itself highlights patterns of variable appearance, the knowledgeable researcher gains a quantifiable, statistically-supported basis for the investigation of usage patterns, rather than relying on anecdotal observation, which has now become all but obsolete. The Art of Counting believes that anecdotes can only support research, not build it. Data is king.
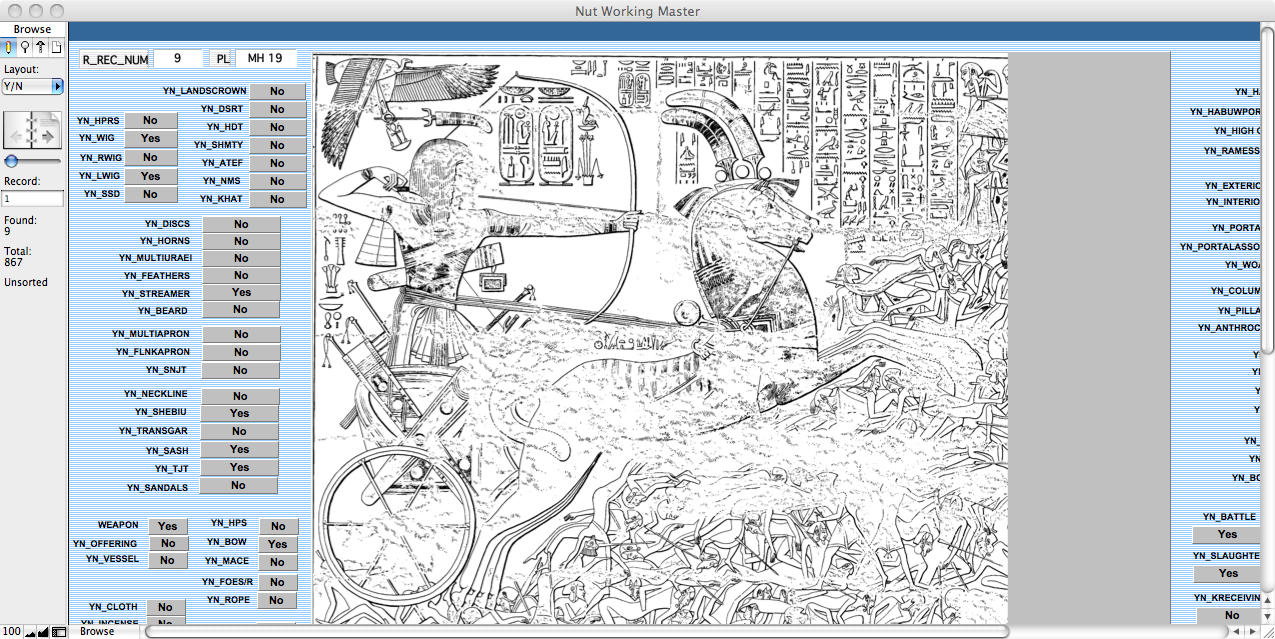
My Ph.D. dissertation entailed the assemblage of computational methodologies capable of providing such quantifiable data about the appearance patterns of attributes (in my case, focusing on the king’s costume and interactions) within a collection of scenes. For this initial baseline study I chose the mortuary temple of Ramses III at Medinet Habu for several reasons. The primary reason was its comparatively complete level of preservation, but this monument was also chosen because of the availability of a full epigraphic survey of the structure (link is to the first of 8 volumes–all now available for pdf download from the Oriental Institute of the University of Chicago), the large number and variety of scenes depicted, and the complexities of the king’s costume in many of the depictions. In order to effectively and efficiently examine these reliefs, I designed and built a database to capture the desired information about each scene in the temple. After much trial and error, and in consultation with more than a dozen professional statisticians and data analysts, this database was designed in a way that the 132 core variables were recorded as binary questions.
Screen shot of a portion of the record for MH plate 19 in the current database layout:
By making the questions binary, the data can be exported for use in many types of advanced statistical analysis. A professional data analyst, Lili Garrard, has been my primary analytical partner for more than three years. When the data from all the Medinet Habu scenes had been entered, I sent the datafile to Lili. She then applied a variety of advanced statistical methods to the data and sent me the results.
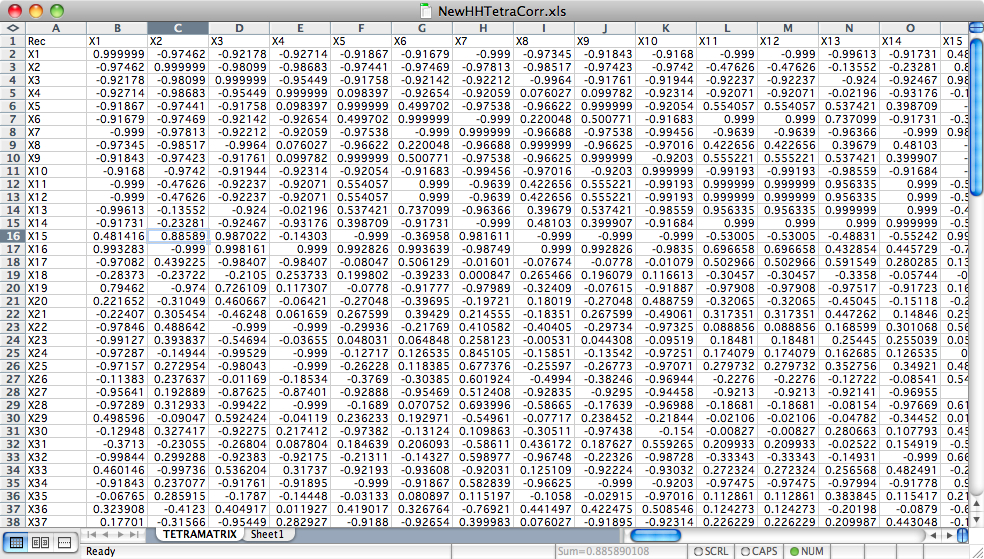
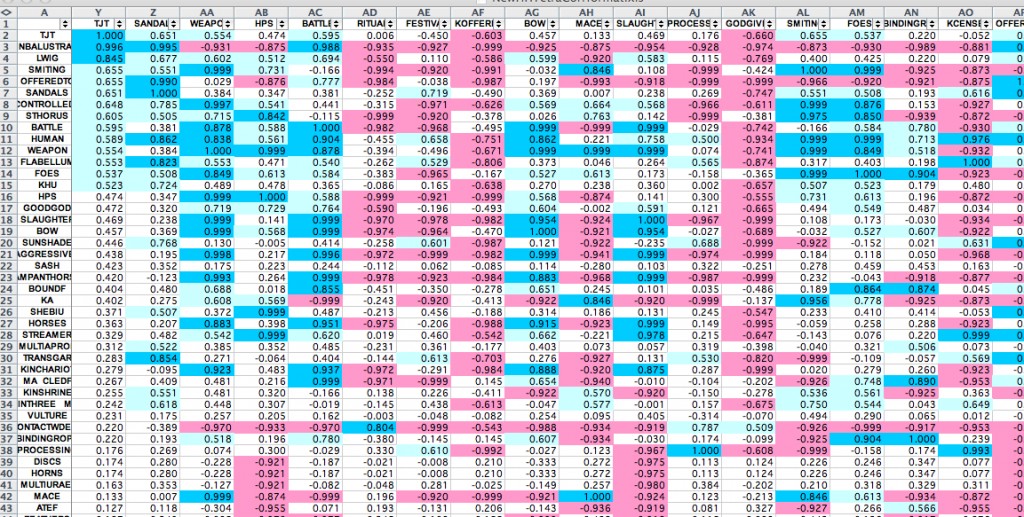
One of the most useful analytical methods we have used to date is tetrachoric correlation. Upon receiving tetrachoric results, I clean the worksheet and apply conditional formatting to make the results easy to scan. You can see the essential difference this step makes by comparing the images below.
Portion of tetrachoric correlation results as received from the analyst (unformatted):
Portion of tetrachoric correlation results after clean-up and conditional formatting (light blue= ‘interesting’ (0.50-0.79) positive connections; dark blue= significant (0.80-1.00) positive connections; pink=strong (-0.50-1.00) negative connections):
Upon analyzing the data from Medinet Habu, the red looped sash (labeled ‘TJT’ on the worksheet in row 1/column 1) was one of the many attributes that stood out due to the specificity of its appearances and the strength of its connections to certain other variables. Just a glance at the above portion of tetrachoric results revels that there are a large number of potential research paths (even complete dissertation paths) that could be followed from this single analysis.
The looped sash was one of the five items of royal regalia that I chose to examine as the case study for my dissertation. These five attributes ably demonstrated the power of the computational methodology by highlighting overlapping usage patterns related to their contextual appearances that would be nearly impossible to discern using more traditional methods of research. Investigations that would have previously taken months or even years using a paper-based approach can now be accomplished in seconds. Additionally, by using this computational methodology, hidden patterns in the data that may never have even been noticed using traditional methods become clearly identifiable through statistical analyses.
The looped sash was the least researched of the five attributes–the others being the lappet wig, ‘transparent’ garment (an enveloping, sheer overgarment), sandals, and the flabellum (sunshades and khu-fans)–and I wanted to share what I had found about this enigmatic regalia element. A previous two-part post analyzed my findings on sandals, and a presentation of my investigation of the lappet wig is currently in the works. Future posts on the remaining elements are also planned and once my dissertation is successfully defended (*fingers crossed for a November defense*) I will present the results of the intricate examination of the five attributes and demonstrate how they overlap in their usage to support the king in his various roles as guardian of Egypt, provider for the gods, and intermediary between the cosmic and terrestrial realms. The subtleties of these interconnected appearances of the five attributes would have been almost imperceptible without utilizing the analytical method developed for this project, but they were clearly indicated through this combined approach and provided the framework for deeper research into the patterns apparent in the statistical results.
Let the data show the way!
